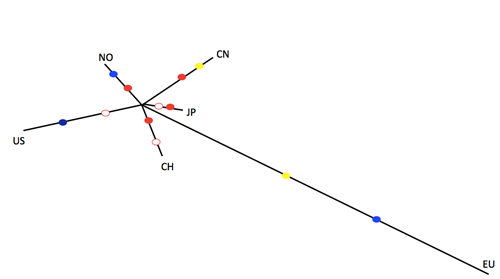
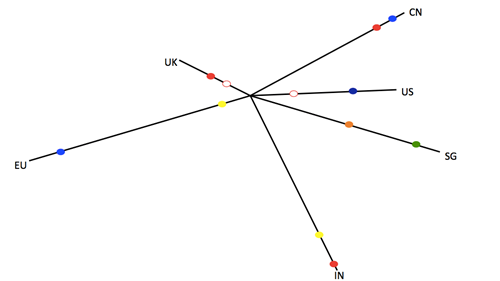
The solutions developed by the GSU focus on offering the best possible price-stability between currencies, through a new type of market-based exchanges.
These new exchange rates differ from those used for pricing currencies today, as the price-formation mechanism of these new rates is based on a plurality of actual underlying data and not only a single-factor pricing model operating directly between two parties. As underlying data used for these solutions can be updated on an ongoing basis without interruptions in the real-time pricing system, the exchange rates are fully functional.
The two solutions available are established from the point-of-departure of optimizing stability for both:
A) A given country - namely through the National Equilibrium Weighted Exchange rates, and
B) For all countries together: the Global.
National
The National Equilibrium Weighted Exchange Rates.
Our systems enable us to identify what we call the exchange rate ‘point-of-balance’ for any given country/currency area based on actual underlying data, which can include elements such as remittances, foreign direct investment, trade, etc. relative to changes in monetary value against other countries.
The optimal basket is the one that minimizes the risk (measured by variance) of the nation’s total payments. Formally: The b that solves
 |
where w is the observable vector of trade weights, Σb is the currency covariance matrix for a given basket composition, and the minimization is performed over baskets with positive entries scaled so that the initial values of pegged and actual exchanges are equal.
One way to illustrate such a ‘point-of-balance’ you can see below. Here the difference between two countries’ point-of-balance is easy to see, as the first (United Kindom) has a different set of underlying data and references compared to those of Bangladesh.
 |
 |
You can see these National Equilibrium Weighted Exchange rates for a number of representative countries here.
Global
The Global Center of Exchange Rate Gravity
Live-rates for the GSU, historical charts and volatility comparisons are available to you here.

